Drawing on Images
We can draw different things on the images, we can draw basic forms such as circle and rectangles, etc, we can put text and more complex figures all using cv2
First we will need the imports
Create the 'Canvas' for drawing
We can draw in any images, but in this case we will use a black canvas so it will be easy
we are using the Numpy function to create an array of zeros, and since the shape is 512x512x3 this means that is an image of 512x512 with 3 channels of color, and all this colors are \(0\), so if we display it will be a black image of 512x512.
Shapes
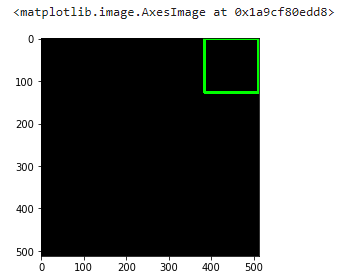
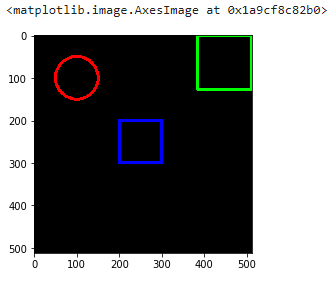
Rectangles
the rectangle function will have some parameters:
- img: the image where we are going to draw
- pt1: the vertex of the rectangle, basically the top left corner
- pt2: the vertex opposite to pt1, means the lower right corner
- Color of rectangle: the color or brightness(in case of grayscale img) RGB format
- thickness: the thickness of the lines that make up the rectangle ( if you want to fill all the rectangle or figure you can use
-1as value) - the are two parameters more, the linetype, and shift that we are not going to address here.
if we check the previous statement we will have a Numpy array, but if we use imshow we will have the image with the rectangle in the points we set up
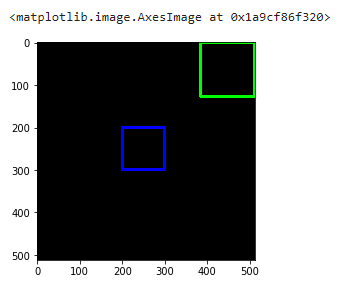
now one in the center of the canvas
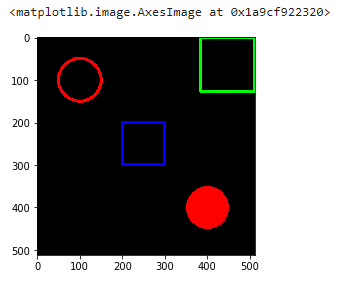
Circle
For the circle the parameter change from vertex to center point and radius, so to draw a circle
now let's change the value of thickness to \(-1\) so we filled in the circle
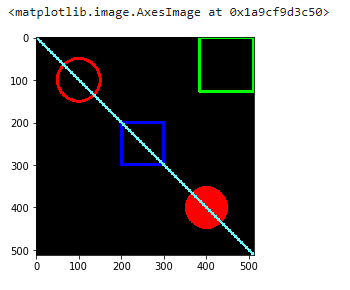
Lines
We can create lines in a similar way we create the rectangle, in this case pt1 and pt2 are starting and ending point instead of vertex.
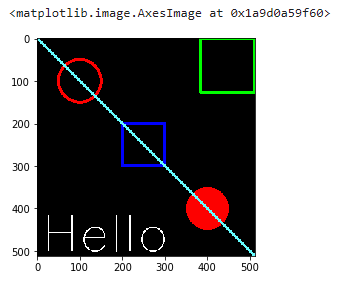
Text
now for the text we need first to select the font we are going to use, in this case we are limited for the fonts already in cv2 we have other arguments:
- text: the text we want to display
- org: the origin point, where the text will start
- fontFace: the font we are going to use
- fontScale: the size of the font
- linetype, for now we are going to use
cv2.LINE_AA
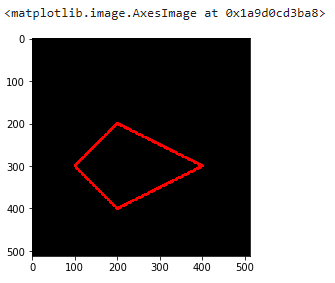
Polygons
For the polygons we will have some changes, first we will need to create an array with the vertex and later reshape this array to ROWSx1X2 and this should be a int32 array.
the new parameter will be isClosed that we need to set as True to close the figure